Showing posts with label esx. Show all posts

Wednesday, March 16, 2016

Delete All Snapshots Fails


Delete all snapshots Fails


Today I encountered an old misunderstood principle again. An admin had created several snapshots on a virtual machine. Several… well to be exact 15. All snapshots were larger than 20GB. When the VMFS volume, on which this VM was located, ran out of diskspace he decided to use the button “Delete All”, but within a couple of minutes the VMFS volume ran out of diskspace again. What happened?
Situation:
Snapshot 1 – 20GB
Snapshot 2 – 10GB
Snapshot 3 – 30GB
When you choose “delete all” the following will happen:
  1. Snapshot 2 will grow to 40GB at most
  2. Snapshot 1 will grow to 60GB at most
  3. Snapshot 1 will be committed to the original VMDK
  4. All snapshot files are deleted
In other words: Snapshot 3 is merged into Snapshot 2, Snapshot 2 is merged into Snapshot 1, Snapshot 1 is merged into the original flat.vmdk and afterwards all snapshot files are deleted. This means that if you want to delete all snapshots at once you will need around 130GB of free diskspace. So think twice when you press the “delete all” button.

Tuesday, December 22, 2015

Understanding NUMA and Virtual NUMA (vNUMA) in vSphere

Understanding NUMA and Virtual NUMA (vNUMA) in vSphere

Working with a recently, we had the experience of designing a solution involving a number of very large (average 12-16 vCPU) machines. In order to maximize the performance of these VMs, we needed to fully understand the intricacies of server resource management technologies NUMA and vNUMA. Failing to understand how they worked could have cost the customer performance gains that these technologies offer.

So what are NUMA and vNUMA, exactly? And how does the proper understanding of them benefit an administrator’s virtual environment?

So, what is NUMA?
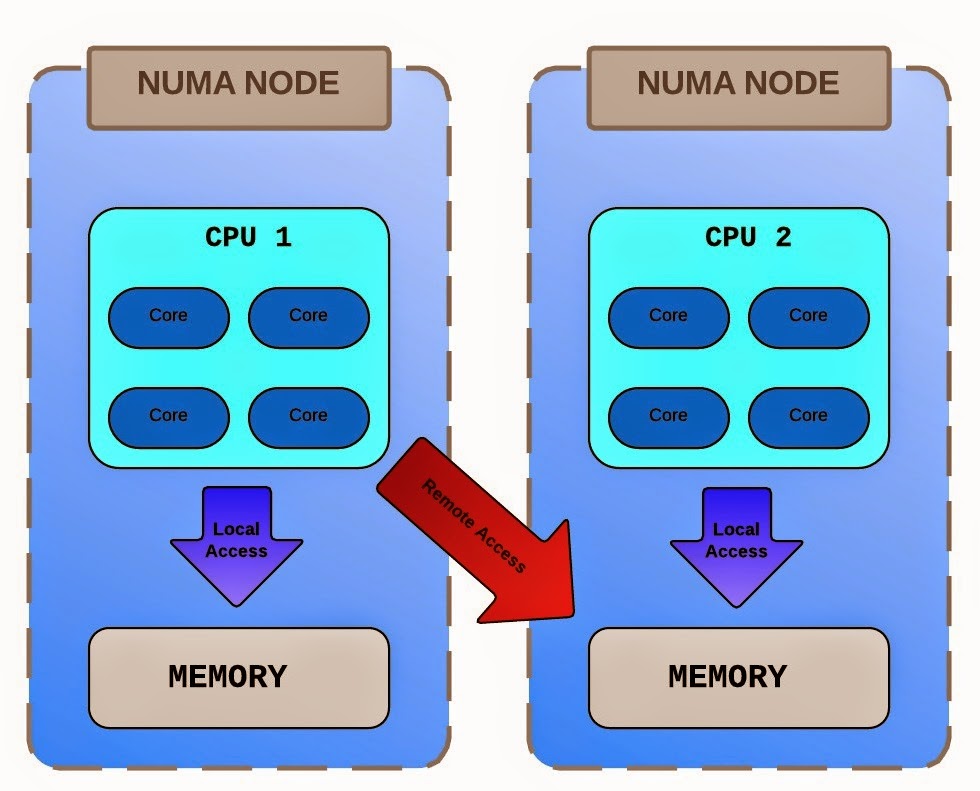
“NUMA,” which is short for “Non-Uniform Memory Access,” describes a system with more than one system bus. CPU resources and memory resources are grouped together into a “NUMA node.”

The memory in a NUMA node is thus much more easily accessed by an associated CPU. A CPU that needs to access memory in a different node (“Remote Access”) will experience much higher latency, and thus reduced application performance. 
NUMA is, in short, an alternative approach to server architecture that links several small, high-performing nodes together inside a single server case.


So, why NUMA?
So long as the memory and CPU being used falls within the bounds of the NUMA node, local communication within a NUMA node allows a CPU much faster access to memory than in an ordinary system layout. This is especially important in the multi-GHz era of today, when CPUs operate significantly faster than the memory they are using. NUMA helps keep CPUs from entering a stalled state, waiting for data, by allowing the fastest possible access to memory.

How do I determine the size of my NUMA nodes?
According to Microsoft, “In most cases you can determine your NUMA node boundaries by dividing the amount of physical RAM by the number of logical processors (cores).” This can be considered a very loose guideline. Further information on determining the specific setup for your NUMA nodes can be found here:
Virtual NUMA
ESX has been NUMA-aware since at least 2002, with VMware ESX Server 1.5 introducing memory management features to improve locality on NUMA hardware. This has worked well for placement of VMs and memory locality for resources being used by that virtual machine, particularly for virtual machines that are smaller than the NUMA node. Large VMs, however, could benefit from extra help when it comes to scheduling their applications.  
When enabled, vNUMA exposes a VM operating system to the physical NUMA topology. This allows for performance improvements within the VM by allowing the operating system and applications to take advantage of NUMA optimizations. This allows VMs to benefit from NUMA, even if the VM itself is larger than the physical size of the NUMA nodes.
A few quick points:

·         An administrator can adjust, enable, or disable vNUMA on VMs using advanced vNUMA controls.
·         If a VM has more than eight vCPUs, vNUMA is automatically enabled.
·         If you enable CPU HotAdd, vNUMA is disabled.
See section 14, “Using NUMA Systems with ESXi” in the vSphere Resource Management Guide for more details.


What happens regarding vNUMA during a vMotion between hosts?
A VM’s vNUMA topology will mimic the topology of the host on which it is initally placed; this topology does not adjust if a VM moves to a different host unless the VM is restarted.  This is another excellent argument for keeping your hardware consistent within an ESXi cluster, as moving the VM to an ESXi host with a different NUMA topology could result in lost CPU/Memory locality and reduced performance.

For more information, consult the "Guest Operating Systems" section of the VMware Performance Best Practices guide.


In conclusion
Regardless of your virtualization platform, NUMA plays an important part in understanding performance within a virtual environment. VMware, in ESXi versions 5.0 and beyond, has extended the capabilities of large VMs by intelligent NUMA scheduling and improving VM-level optimization with vNUMA. It is important to understand both your NUMA and vNUMA topologies when sizing your virtual machines.

Monday, December 14, 2015

esxtop and resxtop

esxtop and resxtop


These two tools are used to monitor and gather performance data from an ESXi host.
  • esxtop. This gives real time CPU, memory, disk and network data for hosts and virtual machines. You can run esxtop from a direct connection to a host’s CLI
  • resxtop. This is a remote version of esxtop. It is included as part of vCLI and is present on the vMA (vSphere Management Assistant). resxtop has three modes of operation including Interactive, Batch, and Replay.
Example resxtop output
 7:30:37pm up  1:38, 206 worlds, 0 VMs, 0 vCPUs; CPU load average: 0.01, 0.01, 0.00
PCPU USED(%): 0.9 1.2 0.5 0.6 AVG: 0.8
PCPU UTIL(%): 1.0 1.6 0.6 0.7 AVG: 1.0

      ID      GID NAME             NWLD   %USED    %RUN    %SYS   %WAIT %VMWAIT    %RDY   %IDLE  %OVRLP   %CSTP  %MLMTD  %SWPWT
       1        1 idle                4  397.21  400.00    0.00    0.00       -  400.00    0.00    0.94    0.00    0.00    0.00
     817      817 hostd.2861         13    1.61    1.70    0.01 1298.25       -    1.33    0.00    0.00    0.00    0.00    0.00
       8        8 helper             82    0.28    0.28    0.00 8200.00       -    0.09    0.00    0.01    0.00    0.00    0.00
     995      995 vpxa.3060          18    0.24    0.24    0.00 1800.00       -    0.35    0.00    0.00    0.00    0.00    0.00
     639      639 vmkiscsid.2670      2    0.05    0.05    0.00  200.00       -    0.01    0.00    0.00    0.00    0.00    0.00
     607      607 vmsyslogd.2625      3    0.02    0.03    0.00  299.87       -    0.37    0.00    0.01    0.00    0.00    0.00
       2        2 system              9    0.01    0.01    0.00  900.00       -    0.02    0.00    0.00    0.00    0.00    0.00
       9        9 drivers            11    0.01    0.01    0.00 1100.00       -    0.01    0.00    0.00    0.00    0.00    0.00
    1029     1029 vmware-usbarbit     2    0.01    0.01    0.00  200.00       -    0.01    0.00    0.00    0.00    0.00    0.00
     859      859 dcbd.2906           1    0.01    0.01    0.00  100.00       -    0.00    0.00    0.00    0.00    0.00    0.00
     702      702 storageRM.2745      2    0.01    0.01    0.00  200.00       -    0.00    0.00    0.00    0.00    0.00    0.00
Most of the examples you will see here will be ran from a vMA. So long as fastpass is configured correctly, there is no need to authenticate each time the tool is run.

How to Configure esxtop/resxtop custom profiles

There are a lot of options available to you when using esxtop. When running the tool, pressing ‘h’ will show you what options are available:
Interactive commands are:

fF      Add or remove fields
oO      Change the order of displayed fields
s       Set the delay in seconds between updates
#       Set the number of instances to display
W       Write configuration file ~/.esxtop50rc
e       Expand/Rollup Cpu Statistics
V       View only VM instances
L       Change the length of the NAME field
l       Limit display to a single group

Sort by:
        U:%USED         R:%RDY          N:GID
Switch display:
        c:cpu           i:interrupt     m:memory        n:network
        d:disk adapter  u:disk device   v:disk VM       p:power mgmt
So, as an example, you can press ‘d’ to access stats around the disk adapters:
7:44:11pm up  1:51, 205 worlds, 0 VMs, 0 vCPUs; CPU load average: 0.01, 0.01, 0.01

 ADAPTR PATH                 NPTH   CMDS/s  READS/s WRITES/s MBREAD/s MBWRTN/s DAVG/cmd KAVG/cmd GAVG/cmd QAVG/cmd
 vmhba0 -                       0     0.00     0.00     0.00     0.00     0.00     0.00     0.00     0.00     0.00
 vmhba1 -                       3     0.00     0.00     0.00     0.00     0.00     0.00     0.00     0.00     0.00
vmhba32 -                       1     0.00     0.00     0.00     0.00     0.00     0.00     0.00     0.00     0.00
vmhba33 -                       2     0.00     0.00     0.00     0.00     0.00     0.00     0.00     0.00     0.00
From that screen you can press ‘f’ to select what fields to wish to view:
Current Field order: ABCdEfGhijkl

* A:  ADAPTR = Adapter Name
* B:  PATH = Path Name
* C:  NPATHS = Num Paths
  D:  QSTATS = Queue Stats
* E:  IOSTATS = I/O Stats
  F:  RESVSTATS = Reserve Stats
* G:  LATSTATS/cmd = Overall Latency Stats (ms)
  H:  LATSTATS/rd = Read Latency Stats (ms)
  I:  LATSTATS/wr = Write Latency Stats (ms)
  J:  ERRSTATS/s = Error Stats
  K:  PAESTATS/s = PAE Stats
  L:  SPLTSTATS/s = SPLIT Stats
Once you have set it up to display the values you are interested in you can press ‘W’ to save the config to a file. You can accept the default or type your own path as necessary.
Save config file to (Default to : /home/vi-admin/.esxtop50rc): /home/vi-admin/.esxtopdiskadrc
Next time you need to view those specific stats in resxtop you can open it, referring to the file you saved:
vi-admin@vma:~[192.168.88.134]> resxtop -c .esxtopdiskadrc

 8:16:58pm up  2:24, 206 worlds, 0 VMs, 0 vCPUs; CPU load average: 0.01, 0.00, 0.00

 ADAPTR PATH                   CMDS/s  READS/s WRITES/s MBREAD/s MBWRTN/s
 vmhba0 -                        0.00     0.00     0.00     0.00     0.00
 vmhba1 -                        0.00     0.00     0.00     0.00     0.00
vmhba32 -                        0.00     0.00     0.00     0.00     0.00
vmhba33 -                        0.00     0.00     0.00     0.00     0.00

Determine use cases for and apply esxtop/resxtop Interactive, Batch and Replay modes

esxtop/resxtop has three modes in which it can be run:
  • Interactive. This is the default mode, and the one used in the example above. By default statistics are collected at a 5 second interval, although this can be changed.
  • Batch. This mode is used for collecting statistics for a period of time, for later analysis. Once the stats have been collected, they can be analysed using Excel, Perfmon or ESXplot amongst other tools.
  • Replay. This mode allows you to replay data collected using the vm-support tool. You cannot replay data collected in batch mode interactively.

Collecting Data using Batch Mode

There are a few options to set when doing a batch mode collection – the various resxtop options are shown here:
vi-admin@vma:~> resxtop --help
usage: resxtop [-h] [-v] [-b] [-s] [-a] [-c config file] [-d delay] [-n iterations]
               [--server server-name [--vihost host-name]] [--portnumber socket-port] [--username user-name]
              -h prints this help menu.
              -v prints version.
              -b enables batch mode.
              -s enables secure mode.
              -a show all statistics.
              -c sets the esxtop configuration file, which by default is .esxtop50rc
              -d sets the delay between updates in seconds.
              -n runs resxtop for only n iterations.
              --server      remote server name.
              --vihost      esx host name, if --server specifies vc server.
              --portnumber  socket port, default is 443.
              --username    user name on the remote server.
The example below, ran from a vMA, will collect stats at 5 second intervals, 20 times. The -a switch indicates that you want to collect all stats:
vi-admin@vma:~[192.168.88.134]> resxtop -b -a -d 5 -n 20 > output.csv
Rather than collect all stats, you can specify a configuration file such as the one I used earlier. Batch mode will then only capture the stats specified in the file.
vi-admin@vma:~[192.168.88.134]> resxtop -b -a -d 5 -n 20 -c .esxtopdiskadrc > output2.csv
Be aware that the size of the capture files can grow quickly!
-rw------- 1 vi-admin root 2.6M Oct 24 14:49 output.csv
With this in mind, it’s possible to compress the output file as it is collected:
vi-admin@vma:~[192.168.88.134]> resxtop -b -a -d 5 -n 20 | gzip -9c > output.csv.gz
The zipped file is significantly smaller than the unzipped version:
-rw------- 1 vi-admin root 114K Oct 24 15:01 output.csv.gz

Replaying Performance Data using ESXTOP

You can also capture performance data using the vm-support tool. vm-support is a tool most commonly used to capture log and configuration data to send to VMware, however it can also be used to capture performance data. There are a number of options that can be specified when running vm-support:
~ # vm-support -h
Usage: vm-support [options]

Options:
  -h, --help            show this help message and exit
  -g GROUPS, --groups=GROUPS
                        Gather data from listed groups
  -a MANIFESTS, --manifests=MANIFESTS
                        Gather from listed manifests
  -e EXCLUDEMANIFESTS, --excludemanifests=EXCLUDEMANIFESTS
                        Exclude the listed manifests
  --listmanifests       List available manifests
  -G, --listgroups      List available manifest groups
  -t, --listtags        List available manifest tags
  -p, --performance     Gather performance data
  -d DURATION, --duration=DURATION
                        Duration of performance monitoring (in seconds)
  -i INTERVAL, --interval=INTERVAL
                        Interval between performance snapshots
  -v VM, --vm=VM        Gather detailed information about this specific VM (ie
                        --vm )
  -V, --listvms         List currently registered VMs
  -w WORKINGDIR, --workingdir=WORKINGDIR
                        Directory to create .tgz in
  -D, --dryrun          Prints out the data that would have been gathered
  -s, --stream          stream data to stdout
  -q, --quiet           Output only the location of the bundle
  -E ERRORFILE, --errorfile=ERRORFILE
                        Prints (non-fatal) errors to specified file (overrides
                        --quiet and --stream)
  --loglevel=LOGLEVEL   Set logging to specified level: 0-50 (0=most verbose)
  --version             Display the vm-support version
  -l, --listfiles       List all files gathered by vm-support
~ #
To capture performance data only, the -p switch is used. As with batch mode for esxtop we have to set the length of the capture and the interval. The following command will capture performance statistics for 60 seconds at 10 second intervals, writing the capture to a VMFS datastore:
/var/log #  vm-support -p -d 60 -i 5 -w /vmfs/volumes/datastore1/
15:45:47: Creating /vmfs/volumes/datastore1/esx-esxi1.vmlab.local-2012-08-10--15.45.tgz
15:48:39: Done.
Please attach this file when submitting an incident report.
To file a support incident, go to http://www.vmware.com/support/sr/sr_login.jsp
To see the files collected, run: tar -tzf '/vmfs/volumes/datastore1/esx-esxi1.vmlab.local-2012-08-10--15.45.tgz'
The collected data will be in a zipped file, in order to save space. To work with it we will need to extract the contents as suggested in the commands output:
tar -tzf '/vmfs/volumes/datastore1/esx-esxi1.vmlab.local-2012-08-10--15.45.tgz
Once extracted it may be necessary to run the reconstruct.sh script which can be found in the extracted contents. This will be necessary if you receive an error stating ‘all vm-support snapshots have been used’
Once the files have been extracted, you can run esxtop in replay mode by running the following:
/var/log # esxtop -R esx-esxi1.vmlab.local-2012-08-10--15.23
The data will be replayed in esxtop:
 3:25:41pm up  1:05, 294 worlds, 0 VMs, 0 vCPUs; CPU load average: 0.14, 0.07, 0.03

 ADAPTR PATH                 NPTH   CMDS/s  READS/s WRITES/s MBREAD/s MBWRTN/s DAVG/cmd KAVG/cmd GAVG/cmd QAVG/cmd
 vmhba0 -                       0     0.00     0.00     0.00     0.00     0.00     0.00     0.00     0.00     0.00
 vmhba1 -                       3    14.52     4.25     8.20     0.26     1.37     1.18     0.01     1.19     0.29
vmhba32 -                       1     0.49     0.00     0.00     0.00     0.00     0.28     0.02     0.30     0.01
vmhba33 -                       2     2.17     1.38     0.00     0.10     0.00     9.06     0.01     9.07     0.00
*** Read stats from esx-esxi1.vmlab.local-2012-08-10--15.23/snapshot-3/commands/vsi_traverse_-s.txt ***
Notice the last line of the output, which indicates that esxtop is being run in replay mode, with the performance stats being read from a file.

Thursday, May 1, 2014

Application Virtualization Options

A colleague recently asked me what tools I use or have used for application virtualization. After the conversation, I realized the topic became quite involved and detailed, and decided to organize the comments and information. 

There is no doubt that there is a plethora of application virtualization tool out there. The question is, “How do you tell them apart?”

Application Virtualization divorces the apps from the OS; allowing it to be delivered efficiently. Other benefits include: applications not needing to be installed on the end user computing device, easier to patch and upgrade, concurrent execution of multiple versions of the same app on the same end user computing device, and application streaming allows delivery to all sorts of mobile devices or endpoints (B.Y.O.D.).


Major players in this quadrant include VMWare ThinApp, Citrix XenApp, and Microsoft APP-V. Each product integrates best with its own vendors product offerings; for instance, Microsoft Hyper-V with App-V or VMWare Horizon with ThinApp.
The following application virtualization comparison, I’ll cover the different features, capabilities and support these tools offer.


Citrix XenApp – ThinApp and App-V only provide app virtualization. XenApp is an overall. application delivery system. Citrix Streaming  is the vendor's application virtualization technology. XenApp is useful for IT shops that have a wide variety of applications -- old and new -- and want to virtualize apps with Citrix Streaming that ThinApp and App-V don't support. Citrix XenApp 6.5 reduces application launch times through the Instant App Access feature. Improvements to the HDX protocol also allow apps to be run in higher-latency environments. Plus, XenApp 6.5 includes a mobility pack that improves application delivery to mobile devices.


VMWare ThinApp – ThinApp offers a couple of capabilities XenApp and App-V do not. For instance, it can deliver offline applications, and it's the most portable of the application virtualization tools. You can run ThinApp applications from almost anywhere because users don't need to install software or device drivers. Some administrators say ThinApp is somewhat cumbersome to deploy. It's also trickier to manage applications because it doesn't come with a centralized management platform. ThinApp 4.6 integrates with VMWare View 4.5 and above. ThinApp Factory automates the application packaging process. This virtual appliance, which plugs into vCenter or VMware Workstation, takes the encoding and distribution out of administrators' hands.


Microsoft App-V - App-V provides centralized management, so admins can limit users' access to certain apps. The latest version, App-V 5.0, reduces disk requirements by allowing IT to turn off local application storage. Plus, it has enhanced application diagnostics and monitoring. App-V has an agent component that pushes applications to the user without Active Directory settings, using Microsoft System Center Configuration Manager. This application virtualization tool also allows you to break down application suites (such as Office) and deliver the apps without losing any integration functionality.

ThinApp has portability in its pocket, but App-V supports 64-bit and server applications, which ThinApp does not.


Alternatives to the major vendors of application virtualization do exist out there. For instance, Spoon Studio is easy to use and integrates with the company's cloud offering. InstallFree is another choice, but it doesn't offer offline functionality.


Spoon Studio
Spoon used to be called Xenocode and was more widely recognized as an OEM product from Novell called Zenworks Application Virtualization.
The company, now called Spoon Inc., offers the Spoon Studio application virtualization product along with Spoon Server and Spoon.net. Spoon Studio is very easy to use and can integrate with either a physical delivery system (such as USB or Spoon Server) or its cloud offering Spoon.net. It is a very versatile product.


Evalaze
Evalaze is a newer application virtualization tool on the market. It has three editions: a free Private edition, Professional edition and Commercial edition. The free edition is severely limited in features compared to the other two, but it does allow for an unlimited number of virtualized applications.
I wanted to try the Professional edition, but they do not offer a trial link for download. However, they do have a Commercial edition trial, which includes the proverbial kitchen sink of tools for your use, including distribution licenses and technical support. I had some trouble sending a request for the trial, but it looks promising from their marketing. You'll need to judge for yourself if you can get them to answer!
The company also has an application virtualization "service," which takes the application and files that you upload and creates the virtualized package for you. That's kind of cool in today's world of Software as a Service.


InstallFree
This is a tough one. I really like the InstallFree interface, pricing (free or subscription-based) and versatility of this app virtualization tool. However, you must have an Internet connection to use it. It doesn't provide the same offline functionality of VMware ThinApp or others. If having your application available offline is not a deal-breaker for you, this product might be up your alley.


Portable Apps
Portable Apps provides a basic way to create and carry your applications wherever you go on a USB stick or drive. It is really what VMware ThinApp started out to be, but the vendor evolved ThinApp into a very large package with added functionality. Sometimes, you just need an application to be portable, and this product does that very well.
I believe all administrators should have this as a core item in their admin toolbox. Best of all, it's free, requires no registration and never nags you.


Symantec Workspace Streaming
This product is most often used by administrators that want to virtualize as many applications as possible or want to micro-manage their app license tracking. Symantec Workspace Streaming does a great job of virtualizing more applications than VMware ThinApp, but it also requires a client agent and streaming server, which ThinApp does not.
Workspace Streaming also lacks an intuitive user interface and is clouded by Symantec Corp.'s difficult licensing and support. ThinApp is more portable than this product and has more flexibility rather than complexity.
VMware ThinApp truly is a flexible, easy to use and versatile application virtualization tool. Still, some administrators need something closer to Portable Apps or will want to check out lower prices.


Friday, April 11, 2014

HOWTO: Re-enable VMware Console copy/paste functionality

HOWTO: Re-enable VMware Console copy/paste functionality

So, if you’re like me, you copy and paste a lot fro your VM consoles – or *want* to.  It kind of drove me nuts for a while, as I was certain I’d done this in the past, hit or miss.  Turns out it’s a feature that got disabled by default after vSphere 4.1 as a “security concern”. 
Now, I can understand why or how it could be a concern, but let’s be realistic:
  • A user who has access to the console, is likely a Domain Admin – or at least a vSphere Admin, unless roles have been delegated

  • We likely have DEV/TEST environments, and/or DMZ’s that have VM’s that can’t easily see, browse, RDP, 
  • etc, to your workstation or other networks.

  • Copy and paste is *good*, darn it!


By far the best option for me is the second option, which enables it for all VM’s on a host:
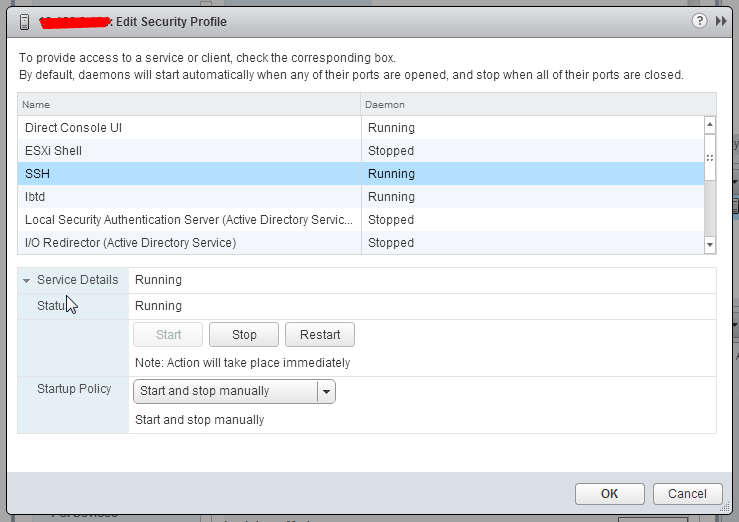
First ensure SSH server is running on the ESXi host.

Then make sure the firewall on the ESXi host will allow SSH connections

  1. Log in to the ESX/ESXi host as a root user.


  1. Take a backup of the /etc/vmware/settings file.


  1. Open the /etc/vmware/settings file using a text editor.


  1. Add these entries to the file: isolation.tools.copy.disable="FALSE" 
    isolation.tools.paste.disable="FALSE"


  1. Save and close the file. 


The Copy and Paste options are only enabled when the virtual machines restart or resume the next time or shutdown and power-on the virtual machine for changes to take effect
It should be noted that these changes will not remain after a host upgrade.  So you may need these to be part of your scripting, use the vMA, or my preference, embed it in your kickstart.cfg files you use for installation customization.